Showing posts with label inflation coming. Show all posts

Wednesday, March 3, 2021

Financial Safety Services Special Reports- March 2nd, 2021


***********************************
Is Widespread $US Price Inflation Definitely Coming?

 A question for you, dear reader : Is price inflation [here defined as an across-the- board steady loss of purchasing power for the $US], definitely  coming our way?

Below are  quotes/links to various finance, economic and investment commentators that made such claims in recent articles, plus one article that proposes further US stock market gains. 

What Do I Think? 
To see my own commentary on these various predictions, and, more importantly, how to avoid having to rely on _any_ predictions,please go to the bottom of this blog entry. 


US Consumer Prices [CPI], in $US, 1875-2003, [log.scale]     

                                                           [N.B.  All graphs at graph index page, here , which has links to all current graphs on this site.]

US Consumer Price Index [CPI] averages , 2000-'21
[N.B.  All graphs at graph index page, here , which has links to all current graphs on this site.]
 
Prediction:"Stagflation Cometh"
"No Inflation in Sight, Why the Inflation Debate?” On one hand, fiscal stimulus is and will be racing through Main Street, some people say. Others claim that “the pandemic hasn’t altered the dynamics of the past dozen years or so when deflation, rather than overheating, has been the big threat.” I might butt in and mention that all stimuli have headed for Wall Street: stocks, bonds, cryptocurrency, and single-family housing."


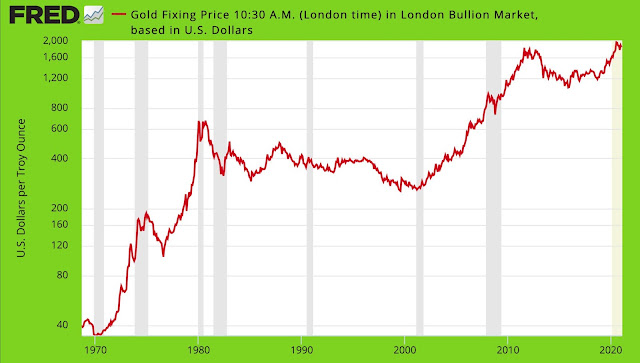
Gold Bullion prices in $US, 1970-'21 [log scale]

"Max Keiser talks to Stephen Flood of GoldCore.com about the case for gold in a bitcoin world, as well as the recent Reddit-driven buying frenzy, which sent silver prices soaring to an eight-year high."


US Federal Reserve Monetary Base[MB] Supply, 2000-21[log scale]


"In the U.S., for example, the quantity of money, measured by M2, has increased by a whopping 26% in a single year. This is the largest annual increase since 1943.The combination of the fast growth of money in circulation and the decline in production capacity, whatever the cause, is the pre-condition for ravaging inflation"

[And last but not least] A Bill Bonner Prediction : "U.S. Policies Will Create Temporary Prosperity"

Standard & Poors [S&P] 500 Index, 2010-21, [log. Scale]

**************************************************

Financial Safety Services Commentary on the various predictions above - Important  Questions For Investors/Speculators: 


So what's comes next, dear reader? Another global plandemic crisis?, bank failures?, stock market crash?, stock market boom?, deflation? , hyper-Inflation?, US dollar crash? 


REALITY FACT: NOBODY, INCLUDING ALL SO-CALLED "EXPERTS", REALLY KNOWS FOR SURE!

See:How To Safely Profit In Stocks,Gold,Crypto's etc., Despite An Unknown & Unknowable Economic Future


*****************************************************
"If it were possible to calculate the future structure of the market, the future would not be uncertain. There would be neither entrepreneurial loss nor profit. What people expect from the economists is beyond the power of any mortal man."  
Ludwig Von Mises.        
 More Von Mises quotes here

 The only function of economic forecasting is to make astrology look respectable.“ 

John Kenneth Galbraith 

*************************

Monday, January 30, 2017

Will The Yellen Fed Cause a Trump Recession?


Ms. Janet Yellen. Fed Chair since Feb. 3rd 2014

The graph below explains the title of this post.

 Obviously, the Fed under Janet Yellen has been gradually decreasing the Monetary Base [MB], that is, the most narrow, generally considered most liquid, money supply figure, since at least the 3rd quarter of 2016:

Fig. 1: Federal Reserve Monetary Base, Non-Seasonally Adjusted, [Fed Chair J. Yellen], 
 January 2014 - December 2016, Millions of $'s, Log scale

Financial Safety Services Commentary:

Exactly What Does The Fed's  Monetary Tightening Mean?: 

It could mean that a recession, at the very least, is on the way during the new  presidents [Donald Trump] first term. [ Basically, a recession within an  ongoing recession/depression]. 

It is impossible to know for certain, and  the picture becomes ever more cloudy if we go back and look at the enormous monetary base  manipulations that have occurred since 2008 [ via Ms. Yellen's predecessor, Ben Bernanke]:


Fig. 2: Monetary Base [MB] , Millions of $'s, Non-Seasonally Adjusted, Federal Reserve, '07- Dec.2016, Log. Scale


Will this more recent tightening under Yellen have any effect on dampening the  effects of the massive Fed monetary base injections of the recent past? Maybe, maybe not. The longer the tightening continues, the more likely it is to actually have an effect and initiate a "Trump recession", in theory at least. 

Good News!

However, here is some good news: it is entirely unnecessary  for  you to have to try to predict/forecast future economic events from graphs [or similar], or to have to rely on [and pay] someone else to do that for you. 


A real world fact: the economic future cannot be accurately predicted via any graph, no matter who constructed it,  or what it claims to show. If you need to know why that is so, then for a very large fee, I can explain to you exactly why all graphs are useless for predicting future economic events.  :-)  

So, if you are worried about your own savings either because of, or despite what is revealed in these graphs/figures, here is some free advice on how to best protect your savings etc.

Regards, onebornfree.
 onebornfreeatyahoodotcom


Three More [Broader], Money Supply Graphs :

Fig. 3: M1 Money Supply, Non-Seasonally Adjusted,  Billions of $'s, Federal Reserve, '07- Dec.2016, Log. Scale


 Fig. 4: M2 Money Supply, Non-Seasonally Adjusted,  Billions of $'s, Federal Reserve, '07- Dec.2016, Log. Scale


Fig. 5: MZM Money Supply, Non-Seasonally Adjusted,  Billions of $'s, Federal Reserve, '07- Dec.2016, Log. Scale

Interest Rates: 


Fig. 6 U.S. 3 month Treasury Bill Interest Rates, January '07-December '16, Monthly Averages, 
Log scale

Fig. 7:U.S. 10 year Treasury Bond Interest Rates, January '07-December '16, Monthly Averages, 
Log scale.


 Fig. 8:U.S. 30 year Treasury Bond Interest Rates, January '07-December '16, Monthly Averages, 
Log scale.